Module Four (C)

Exploring Angles with Pattern Blocks
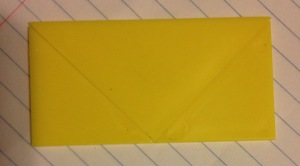
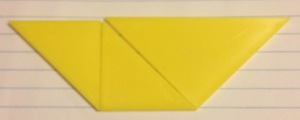
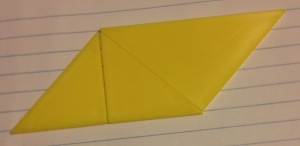
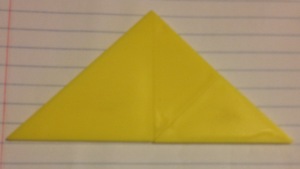
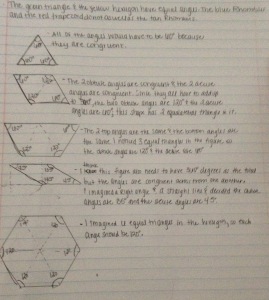
I got all of the angles right except for the tan rhombus. I found that two of the angles were 45 degrees and two of the angles were 135 degrees. The correct answer is two angles at 60 degrees and two angles at 150 degrees. Do you know how to find these measurements? How did you do on this activity?

Annenberg Video Circumference and Diameter
·Describe Ms. Scrivner’s techniques for letting students explore the relationship between circumference and diameter. What other techniques could you use?
-The teacher had students get measurements of different circular objects in the room then asked them what they noticed about the relationship between the two numbers. She also allowed the students to find the objects in the classroom for themselves. Another technique one could use is giving the students a basket or bag of objects to measure. This would minimize the moving around the room and limit misconceptions about what are circles and what are not.
·In essence, students in this lesson were learning about the ratio of the circumference to the diameter. Compare how students in this class are learning with how you learned when you were in school.
-In this class the students looked at the measurements they found and discussed the measurements in correlation with one another. The students were able to see that there was a ratio between the circumference and diameter of the circle. In school, I was given a piece of paper with the circumference and the diameters and discovered the relationship indivually.
·How did Ms. Scrivner have students develop ownership in the mathematical task in this lesson?
-Ms. Scrivner allowed the students to develop ownership in the mathematical task by allowing them to choose the objects they measured, instructed them to measure the object and record the data, share the data with the class, and lead a discussion discovering the relationship between the numbers. They lead this activity.
·How can student’s understanding be assessed with this task?
-The student’s understanding can be assessed by what they contribute to the discussion.

Annenberg Circles and Pi Module
Problem A1:
Use the designs to fill in the table below. For the circle, use string to approximate the circumference.

Design 1 Design 2 Design 3
Diameter of Circle 2 cm 4 cm 6 cm
Perimeter of Hexagon 6 cm 12 cm 18 cm
Perimeter of Square 8 cm 16 cm 24 cm
Approximate Circumference of Circle 6.3 cm 12.6 cm 18.9 cm

Problem B3:  Write and expression for the length of the base b in terms of the radius r of the circle.
-Since the circumfernce of the circle is pi*r*2, and b is half that, the equation would be pi*r.

Textbook Reading and Questions from page 26
1. Explain what it means to measure something. Does your explanation work equally well for length, area, weight, volume and time?
-Measuring is when you take an attribute of an object and find the measure of that attribute in comparison to the units used to measure it. This works for length, area, weight, volume and time.

3. Four reasons were offered for using nonstandard units instead of standard units in instructional activities. Which of these seem most important to you and why?
-Nonstandard units are usually used in lower elementary grades. Since these students are just beginning to learn to measure, the reason that states that students can focus on the attribute being measured as the most important. The students are able to focus on the actual attribute and what that attribute means instead of focusing on the units themselves.

For further consideration….

We have explored numerous areas throughout this semester. Pick five ideas that you will later use in your classroom.
1. I will use the activity used to learn tessellations. I really enjoyed this activity in elementary school and I feel it is a great tool and learning opportunity for students.
2. I want to have hands on activities in my classroom. I did not have a lot of hands on activities in my education, but think they are very beneficial to learning and understanding different concepts.
3. I want to offer manipulatives to my students to help them explore ideas on their own.
4. I will also incorporate applets or other technology to allow another method for students to learn and develop skills.
5. I will work hard to assess the students’ capabilities and will teach on their level. I will provide reviews and discovery lessons to help find the levels of the students and teach them further.
Module Four (C)

Module Four (B)

TCM Article –Rulers
I really liked that the students were learning the concept of using a ruler or another measuring device, but they weren’t overwhelmed with the units of measurement either; that’s something that can come later. I will make sure to clarify the correct way to use a ruler. I was surprised that students were counting the unit marks and the spaces in between. I’m wondering what leads them to this idea, what do you think? Students could have a misconception about what to start counting with; should they start with zero or one. This is something that could be confusing to them because we don’t start counting at zero, we are taught to start with one. What is your idea of why this happens?

Angles Video and Case Studies
In the case studies, students were learning about how angles looked and the different sides of the angle. Students learned how to describe them and as they got older, they learned correct terminology. Students also learned about the angles within different shapes and how the angles are related.

In the video, the children were talking in a basic understanding of angles. They didn’t have all of the terminology but had a good idea of what made an angle and what it would look like. I will take the idea of starting the conversation in a circle. I love “rug” time in a classroom, especially for young students. I think it helps them stay focused on the conversation and they can see what their classmates may be explaining with their hands. Also, I liked how the teacher had the students drawing out what they were explaining, this helped them express their ideas more effectively.

Annenberg Angles Module
Problem A1: Try changing the lengths of the sides on your protractor by adding more straws or cutting the original straw.What happens to the angle when you do this? Do the lengths of the sides of an angle affect the measure of that angle

-The angle does not change when you change the lengths of the sides. The lengths of the sides of an angle do not affect the measure of the interior or exterior angles.

Problem B9:
Based on the data in the table, what is the sum of the angles in a triangle? How might we prove this?
Trace around 4 different triangles and cut them out. Label angle 1 angle 2 and angle 3 in each triangle. Then tear off the angles and arrange them around a point on a straight line, as shown below. What do you notice? Is it the same for all four triangles? Will it be the same for all triangles? Explain.
-The sum of the three angles in a triangle is 180 degrees. We can prove this by taking all of the angles from a triangle and lining them up along a straight line. When all of the angles are connected, they will form the straight line. This is the same for all triangles because all triangles have the same number of degrees when adding up their angles.

TCM Article –How Wedge you Teach?
I really liked how the teacher connected something else they were discussing in class, the rainforest, to the lesson in math. Also, the students were learning by doing; the teacher had the students draw the circle and explain how they could use the circle to measure angles. The children gaining an understanding of this helps them fully grasp the concept. It surprised me that students wanted to label the angles as acute, right or obtuse instead of with a number. I think students often have a misconception of knowing how pieces fit together to make a larger object. For example, the students had a hard time knowing that when you put all of the wedges together, they would form a circle even though they had been discussing angles and how the angles fit together to make the 360 degrees of a circle.

Exploring Angles with Pattern Blocks
FullSizeRender(15) FullSizeRender(16)
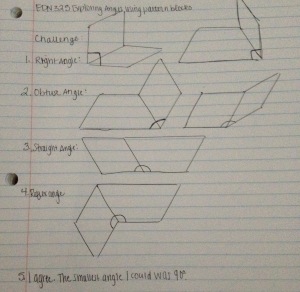
I was able to find only one straight line and one reflex angle when using the non-congruent shapes. Did you find more?

For Further Discussion
As adults we use standard measurements almost without thought. Nonetheless, nonstandard measurements also play a role in speech and behavior. We ask for a “pinch” of salt or a small slice of dessert. We promise to be somewhere shortly or to serve a “dollop” of whipped cream. In some situations we might even prefer nonstandard measurements –for example, in cooking, building, or decorating. Do you or someone you know use nonstandard measurements on a regular basis or even instead of a standard system? Give some examples and discuss why a nonstandard measurement might be preferred in some cases.
-I often times use a nonstandard form of measurement. An instance that pops into my mind is when giving directions. I will say “go up a little ways to the stop sign.” Or when I’m cooking my husband will ask how much of something needs to be used and I may say, “just enough to coat the pan” or “just a little bit of ‘that.’” When do you use nonstandard measurements?

What was your favorite activity? What activities do you see yourself using in your classroom?

Module Four (B)

Module Four (A)

Coordinate Grids
I tried several of the applets including catch the fiy, stock the shelves and maze game. Out of the ones I explored, the Billy Bug and Coordinate Geometry we my favorite and are ones that I would use in my classroom. Not saying I wouldn’t use the others in my classroom, these were just my favorites. One advantage of using online programs is that students can try a variety of tools to help them master skills in mathematics. Another advantage of using online games is that students can work at the level they are on. A disadvantage is that the technology, like ipads, tablets or computers, is needed to play these online games; not all schools may have the funds to supply these. Another disadvantage is that it can be hard to monitor how students are doing on the computer and what they understand.

Miras and Reflections and Kaleidoscopes Article
I had never used a Mira before, but I found the tool very neat and fun to use. I found that I wanted my pictures to be perfect but it was hard to reach perfection using the Mira. There were a couple of times that I put my pen down and had to realize that it was in the wrong spot and had to look for it through the Mira. I definitely will be using this tool in my future classroom. I feel that I had a pretty good grasp on transformations before this activity, but it helped me see how it all works and a helped me gain deeper understanding.

Had you used a Mira before? Did this activity help you gain insight?

Kaleidoscope Article
I really like the first activity the students participate in while in the groups. I think it’s a fun way to learn about reflections when one of the students gets to mirror the other. Also, I think this activity helps the students gain a true understanding of what a reflection is. Without this activity, students may have a hard time grasping that a reflection is the opposite of the starting figure/object. Also, this is a great activity to introduce a mira, how it works and what the students can expect. I think the students really enjoyed making the kaleidoscopes, but I wouldn’t recommend it for younger elementary. I remember using kaleidoscopes in elementary school to talk about geometry and plan to use them as a tool in my classroom. This activity helped students gain a great understanding of transformations.

Annenberg Measurement Module
Problem B2: What unit would you use? Is there more than one choice? Explain.
-There is more than one choice as to what unit I would use. For my rock I would use cm2 because of the size of the rock and my materials. If the rock was much bigger or smaller I would have chosen a larger unit or smaller unit, depending on the size.

Problem B5: What units are you using to measure the water? Can you use this unit to measure the volume of a solid?
-We are using milliliters to measure the water. I am able to use this unit to measure the volume of a solid because milliliters and cm3 are equal.

Case Studies
Throughout these case studies, children were learning how to measure accurately and precisely. We were able to see how each grade measures objects and describes the size of the object according to their level of capability. I really enjoyed seeing the progression of thought and discussion.

For further discussion
A fellow teacher says that he cannot start to teach any geometry until the students know all the terms and definitions and that his fifth graders just cannot learn them. What misconceptions about teaching geometry does this teacher hold?
-This teacher is missing the point that students can measure objects and know their size without knowing the exact measurement. The students will learn the terminology as they perfect their levels of measurement.

Now that you’ve had some time to explore the world of geometry, how has your view of the key ideas of geometry that you want your students to work though changed?
My thoughts on the different levels of geometry have changed. I never realized how much their thought process changed over time and how their skills develop and build on one another. I have also learned a lot about tools to use when teaching the students geometry.

What have you learned about teaching geometry? How have your views changed? What grade do you think you’d most like to teach geometry to?

Module Four (A)

Module Three (D)

Annenberg Symmetry Module
Problem A1: For each figure, find all the lines of symmetry you can.

Problem A2: Find all the lines of symmetry for these regular polygons. Generalize a rule about the number of lines of symmetry for regular polygons.

Pentomino Activities
I found the following website: http://www.izzygames.com/pentomino-puzzle-t4459.html. It is a game similar to the one we played on the scholastic site. I believe any games like this are great practice for the students to work on visualization, location, transformation and symmetry. I played the easy level and mastered it pretty quickly. Then I went onto the medium level. While I figured it out, it took me a bit longer. It seems I need more practice on my visualization!! How about you Brittni? I also am reminded of tetrus as we look at these. Do you think it could be a helpful game to play?

Pentomino Narrow Passage
FullSizeRender(10)
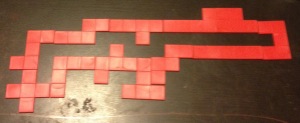
The length of my pentomino narrow passage is 22. I found myself getting frustrated at one point because I’d get it to connect and see a spot that was more than 1 space wide. I feel this exercise took me longer than it should have.

Tessellating T-shirts Article
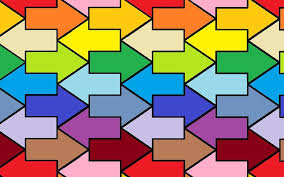
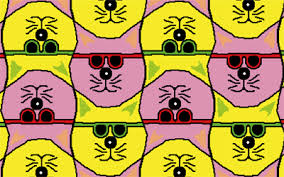
The article took me back to an activity we did in elementary school. Much like this activity we were given rectangles and told to cut out a design on one end and tape it to the other then use it as a stencil to create a picture of tessellations I think this is a great activity that is fun for students but is full of learning. Through this activity students are able to learn more about the vocabulary of transformation in geometry like flip, rotate, ect. To tessellate means repeat a picture with a pattern shape and add color and imagination to make the picture. Here are some tessellations I found:
index images2

Tangram Discoveries
FullSizeRender(12) FullSizeRender(14) FullSizeRender(13) FullSizeRender(11) IMG_0542
·Which polygon has the greatest perimeter?…the least perimeter? How do you know?
-The trapezoid has the greatest perimeter and the square has the least. I figured this because of how the lengths were spread out in comparison to one another.
·Which polygon has the greatest area? …the least area?How do you know?
-I think they will all have the same area because the same shapes that take up the same amount of space made each of the shapes pictured.

Ordering Rectangles Activity
1.Take the seven rectangles and lay them out in front ofyou. Look at their perimeters. Do not do any measuring; just look. What are your first hunches? Which rectangle do you think has the smallest perimeter? The largest perimeter? Move the rectangles around until you have ordered them from the one with the smallest perimeter to the one with the largest perimeter.
-Record your order: C, D, B, A, F, E, G

2.Now look at the rectangles and consider their areas. What are your first hunches? Which rectangle has the smallest area? The largest area? Again, without doing any measuring, order the rectangles from the one with the smallest area to the one with the largest area.
Record your order: C, D, B, A, F, E, G

3.Now, by comparing directly or using any available materials (color tiles are always useful), order the rectangles by perimeter. How did your estimated order compare with the actual order? What strategy did you use to compare perimeters?
From smallest to largest: D, E, A, B, G, C, F. I was pretty far off. Looks can be deceiving at times. I used a ruler to measure each side and calculated the perimeter.

4.By comparing directly or using any available materials (again…color tiles), order the rectangles by area. How did your estimated order compare with the actual order? What strategy did you use to compare areas?
-From smallest to largest: C, D, B, E, F, A, G I did much better on judging the area of the shapes than I did the perimeter. I used the measurements I found earlier and calculated the area of each rectangle.

5.What ideas about perimeter, about area, or about measuring did these activities help you to see? What questions arose as you did this work? What have you figured out? What are you still wondering about?
-This activity further validated what I already knew. I think if I had thought more about the measurements of each side, I would have estimated better on the first one. I was looking more at the area without realizing it at the time.

For Further Discussion
Multicultural mathematics offer rich opportunities for studying geometry. Research the art forms of Native Americans and various ethnic groups such as Mexican or African Americans. What kinds of symmetry or geometric designs are used in their rugs, baskets, pottery, or jewelry? Discuss ways you might use your discoveries to create multicultural learning experiences.
-While looking online at the different art forms of different ethnic groups I saw many geometric shapes and colors. I even noticed some tessellations. We can use these discoveries to talk about these multicultural groups and their cultural rituals and art forms and link them to what we are learning in geometry. It will be a great way to link different areas of study and add some diversity to our lessons. Also, students will see how math/geometry is in our everyday lives and it’s an important part of our education.

Module Three (D)

Module Three (C)

Nets Activity
I think after having the discussion about the different shapes and pentominoes I would give the students the pentominoes in small groups. For beginning students, I would mark the x for them. Then I would have students attempt to fold them into boxes. I was able to complete the activity without much frustration, but I did something very similar to this in school. It can be hard for me to visualize shapes in my head, but once I start making them, it comes pretty smooth to me. While doing this activity with students, it’s important to remember that they may become frustrated and to remind them that it can take them a few tries. Also, it may be difficult for the students to visualize what they are making. Tell them to just start folding and this could lead to a visualization.

Textbook Reading
Question 2: Briefly describe the nature of the content in each of the four geometric strands discussed in this chapter: Shapes and Properties, Location, Transformations and Visualization.
-Shapes and Properties: students work with both 2 and 3-dimensional shapes. This is when students figure out the names of the properties of the shapes and what properties make up which shapes. Special shapes earn their classifications like triangles or pyramids.
Location: Locations uses the method of coordinate systems to analyze and understand the position of different points of a shape or entire positions of a shape in coordination to another shape or object. Words like over, under, near or far are a part of the vocabulary for location. The students’ spatial reasoning containing direction, distance and location is expanded through location.
Transformations: Transformations are the changes in positions or size of a shape. Translations, reflections, rotations and the study of symmetry all fall under transformations.
Visualization: This is how the students see the shape and how it can look from different viewpoints. When using visualization, students transform and unfold shapes to know all aspects of that shape.

Question 4: Find one of the suggested applests or explore GeoGebra and explain how it can be used. What are the advantages of using the computer instead of hands-on materials or drawings?
GeoGebra is a manipulative on the computer that allows students to play with and learn more about geometry and other skills. Students are able to practice and improve their skills through a hands on experience, even if it is on a computer screen. The manipulative being on a computer allows more manipulatives to be used when they may not be readily available for the students and teachers otherwise. Also, many aspects of the child’s learning and testing are moving toward technology and the use of the computer and this gives students more practice with that.

Spatial Readings, Annenberg, and Building Plans
I found the first activity the most challenging. While I got the second activity fairly easily, the third one was a little difficult for me to visualize at times. I could not and still have trouble visualizing the first activity. I just can’t seem to imagine what the activity wants me to.
It is important that students become proficient at special visualization because our world is made up of these shapes and how they are related to one another.
I believe students are ready for visual/spatial activities at some degree as soon as the early elementary grades. Many students have played video games or games on the computer/tablet that has already given them an opportunity to understand visualization without them realizing it.
We can help student become more proficient in this area with practice and more practice. Repetition is important in learning. I also think pairing students at different levels in the area can help them. The student who has a better understanding can help the student who is having a harder time by working with them one-on-one.

Annenberg Tangrams Module and Creation of Manipulative
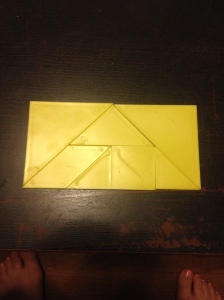
Problem A1: Given that the tangram puzzle is made from a square, can you recreate the square using all seven pieces?
IMG_0542

Problem A2: Use all seven tangram pieces to make a rectangle that is not a square.
IMG_0543


For further discussion
Informal recreational geometry is an important type of geometry in many childhood games and toys. Visit a toy store (or go to an online store) and make an inventory of early childhood toys and games that use geometric concepts. Discuss ways these materials might be used to teach the big ideas of early childhood geometry.

-Two toys come to mind when I think about geometry in children’s toys. First, she has a puzzle of the different shapes. Many basic, early learning puzzles, are full of simple shapes and colors. She has to turn the shape the correct way to get it to fit into the puzzle. This is teaching her the basics to geometric concepts. The other toy I think of is her playhouse. On the mailbox, there is a section for a cylinder piece, a cube piece, and a pyramid piece to be inserted. Again, she has to turn the shapes the correct way to insert the piece. While she is playing with the toy, we always identify what shape is going in for her, but we identify the shape on the mailbox. So we say “circle,” “square,” or “triangle.” This teaches her the concepts of shapes.

Module Three (C)

Module Three (B)

Quick Images Video
After you have taken the time to view the video, discuss in your blogs what you noticed about the children’s responses. Consider how you saw the different shapes and how that compared to the way the students described what they saw.

Quick Images
I noticed in this video that students remembered how to draw the shape by the resemblance to something they see often. They took everyday objects or figures and used them to remember when the image was taken away and they had to draw what they saw. When I saw the image, I automatically thought of a moon and decided that’s how I could remember the image. This is the same way the students in the video remembered.

Case Studies-Shapes and Geometric Definitions
I found the students’ way of thinking and moving toward a definition for different shapes very deep and forward thinking. The students were able to name the attributes of triangles or squares and rectangles but also recognized how their definitions needed to be as clear as possible and that shapes they are unfamiliar with could still be classified under their definition.
I will remember how students think when teaching and moving forward with shapes. One case study mentioned that she wouldn’t present the students with shapes, but have them write what shapes they knew and their attributes. This is something I will consider in my future classroom.
A definition classifies a specific shape, but properties or attributes are used to describe shapes but are not specific to only one shape.
Students need to be clear in their definitions. They need to remember that a definition that is too vague could also describe another shape as well. Students go through the process of how they see a shape and recognize it that transitions to the actual definition. This definition broadens their mind set to see that shapes come in many varieties.

Annenberg Polygons Module
Throughout this module, you are asked to respond to a variety of questions.
Choose at least two of the questions from this module to include in your blog. You are encouraged to choose areas that are causing confusion as your blog partner may help you make the connections that you need for your understanding.
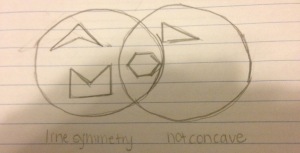
Problem B1: Make a diagram to show how these same four polygons can be grouped into the categories Line Symmetry and Not Concave. Use a circle to represent each category.
FullSizeRender(9)
Problem C4: How would you divide the polygons below into triangles?
FullSizeRender(8)
For further discussion
We have been taught geometry from the time we were small children, from learning about a stop sign to putting a puzzle together. As we get older, we recognize these shapes around us. We see the squares and rectangles on our keyboards. We see the circles on the top and bottom of our lampshades. We see our notebooks in the shape of the rectangle; the list goes on and on.

Module Three (B)

Module Three (A)

Key Ideas in Geometry
I want my students to learn about the shapes and their attributes. I want the students to be able to identify and label the shapes as well as be able to draw them when given the attributes. I want students to know how to find the area, perimeter, volume, ect. of different shapes as well. Students need to learn the proper vocabulary and how to speak and write about the shapes.

Van Hiele levels and Polygon Properties Article
I found the Van Hiele model interesting and useful. I like how each step builds on one another and one [usually] cannot move onto the next level without mastering the prior level. I had never heard of the Van Hiele levels before so this was all new information to me, but all of it made sense and I found meaning in each step. I remember going through each of these phases in my elementary school grades and learning each step before moving onto the next one. I did very well with the activity in the power point, I was able to narrow down to the correct shape each time. I was pretty impressed with myself that I remembered what each of the terms meant in the descriptions/questions. I think recognizing each part of the geometric instruction is important. Before I start teaching geometry in my classroom, I will need to evaluate the students and see what level they are on before I start with the instruction. I also find the need to have a review for my students so that they have a chance to remember and be refreshed. I liked each of the activities from the module. I plan on using the shape sorting activity, poster making, geoboards and group discussions (or some rendition of these activities) to help my students’ learning in geometry lessons.

Annenberg Triangle and Quadrilaterals Module
Problem B5: Can a set of three lengths make two different triangles?
-No, when you have three fixed lengths, they can only make one triangle.

Problem B2:
Suppose you were asked to make a triangle with sides 4, 4, and 10 units long. Do you think you could do it? Explain your answer. Keep in mind the goal is not to try to build the triangle, but to predict the outcome.
No, I do not think this is possible. If you think about putting the until of 4 attached to the ends of the unit of 10, the two units of 4 will not reach each other.


Thinking about Triangles

There are many ways to structure this lesson for students in an elementary class. First, I would have them take out their geoboards and make different triangles. While they are in small groups, I will have them write different things they notice about the triangles they have made. Then I would have them draw different triangles on geoboards and see if they come to any new findings. Next, I would give them different cut outs of triangles and have them group the triangles according to similarities of the triangles. Finally, we would have a group class discussion about the groupings and findings. I would add any missing pieces and give them the terminology like the classifications of triangles and their attributes.
I didn’t really have any trouble with this powerpoint. I remembered all of the words that were mentioned, but did need to be reminded what scalene and isosceles meant. This was a great review and learning opportunity on teaching triangles to elementary students.

Module Three (A)

Module Two (C)

Annenberg Probability Module

Problem B3: A-List all of the possible outcomes of tossing a coin twice. How many are there? What is the probability that each will occur?
-HH, HT, TH, TT. There are four outcomes. This gives each one ¼ of a chance of happening.
B. List all possible outcomes for tossing a coin three times. How many are there? What is the probability that each will occur?
-HHH, HHT, HTT, HTH, THH, TTH, THT, TTT. There are eight outcomes. This gives each one 1/8 of chance of happening.
For this problem I had to write out each outcome to find them all. How would you have found all of the outcomes? Is there another way?

Problem C5: Do you think a tree diagram would help you create a similar probability table for 10 tosses of a fair coin? Why or why not?
-I do not think a tree diagram would help create a similar probability able for 10 tosses of a fair coin. This would be too many options to write out. We need to find a pattern instead.

A Whale of a Tale article
IMG_0512
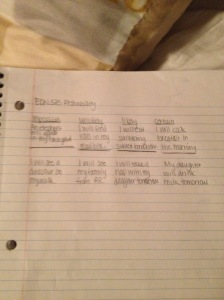
Impossible: An elephant will appear in my back yard. I will see a dinosaur on my walk.
Unlikely: I will find $1000 in my mailbox. I will see my family from Arkansas tomorrow.
Likely: I will eat something sweet tomorrow. I will take a nap with my daughter tomorrow.
Certain: My daughter will drink milk tomorrow. I will cook breakfast in the morning.

Dice Toss
·Ms. Kincaid wanted the students to make predictions about their experiment on the basis of mathematical probability. Discuss preconceptions that students exhibited about tossing dice even after discussing the mathematical probability. Discuss the instructional implications of dealing with these preconceptions.
-One student started to list different ways to get 12, but Ms. Kincaid had her think about it and she realized that using only the number on the dices, 12 can be made only one way.

·Were these students too young to discuss mathematical probability? What evidence did you observe that leads you to believe that students did or did not grasp the difference between mathematical probability and experimental probability? At what age should probability be discussed?
-No, these students were not too young to discuss mathematical probability. They were able to predict what numbers could happen using the two dice. They were able to compare the numbers the number they did predict with the data from their experiment and realize why the numbers lined up. I think the basics of probability can start as early as kindergarten.

·The teacher asked the students, “What can you say about the data we collected as a group?” and “What can you say mathematically?” How did the phrasing of these two questions affect the students’ reasoning?
-The students were focused on the group’s data, but their reasoning changed a little when they thought about the data as mathematical probability instead of experimental.

·Why did Ms. Kincaid require each group of students to roll the dice thirty-six times? What are the advantages and disadvantages of rolling this number of times?
-Ms. Kincaid had the students roll the dice thirty-six times because that how many combinations were possible mathematically. An advantage to this was that it demonstrated the difference in mathematical and experimental probability. Also, it gave an ample sample of data to see the probability. A disadvantage was that it could be hard for students to organize their data or they could lose track of where they were in rolling the dice.

·Comment on the collaboration among the students as they conducted the experiment. Give evidence that students either worked together as a group or worked as individuals.
-The students seemed good at working together. They were each giving insight of past experiences in groups and how they should complete the data retrieval process. They also worked together in problem solving different trials they ran into like how to graph or rolling the dice too many times.

·Why do you think Ms. Kincaid assigned roles to each group member? What effect did this practice have on the students? How does assigning roles facilitate collaboration among the group members?
-Ms. Kincaid assigned roles to each group member to make sure each person was doing their part in the experiment and not one person in the group was doing all of the work. This teaches the students how to work together and how to divide the work evening and work together to finish the task on hand. Assigning the roles makes the students work together because if one person does not complete their part the work is incomplete. The students are held accountable and encouraged to help one another finish their tasks.

·Describe the types of questions that Ms. Kincaid asked the students in the individual groups. How did this questioning further student understanding and learning?
-She asked the students about their data organization process and graphing. She also asked about how the data the students were collecting correlated with their findings with the mathematical probability. This helped the students make the connection between mathematical and experimental probability as well as show the differences.

·Why did Ms. Kincaid let each group decide how to record the data rather than giving groups a recording sheet that was already organized? When would it be appropriate to give students an organized recording sheet? Discuss the advantages and disadvantages of allowing students to create their own recording plans.
-Allowing each group to decide how they would record the data gave the students the ability to find the best way to organize their data and learn for future reference the best way. An advantage to this is that students learn how to organize data they are given or find. This gives them the ability to learn from their mistakes and figure out what way best suits them. A disadvantage is that some students my have to correct what they were doing which is time consuming. For instance, the one girl just listed what each member of her group had rolled and had to reorganize it later before the group could analyze the data found.

For further consideration….
Knowing what you now know about probability concepts in the elementary school, how will you ensure that your students have the background to be successful with these concepts in middle school?
-I will make sure that the students know simple terminology like listed in the Whale of a Tale article. I will use it in everyday terminology where students can make predictions about the weather or other daily activities.

Module Two (C)

Module Two (B)

Box Plots

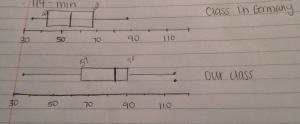
Another scenario to consider: Your students have been weighing the trash that their family discards each day and adding the totals for a month. The stem and leaf plot below shows the pounds of trash discarded for each student in your class. A class in Germany with which you have been communicating by email is keeping the same data. They have sent the box-and-whisker plot of the pounds of trash discarded in their homes for a month. The German class has 42 students. Yours only has 18. The students in your class have access to the data in their stem-and-leaf plot and they know that the other class has 42 students. They do not have the individual numbers for the German data.

a. Make a box and whisker plot for the data in your class and draw it under the German class’s plot using the same scale.
FullSizeRender(1)

b. Suggest three good questions that you could ask your class in making comparisons between the two plots. Answer each of your questions.
-Do you think there are more outliers in the class in Germany or in our class? Why?
-There are more outliers in our class because he “whiskers” are longer.
-Is the median greater in Germany or in our class? Why do you think that is?
-The median is greater in our class. We had a greater range with larger outliers, causing us to have a higher median.
-What would you look at to determine where more trash is produced?
-I would look at the median, which ever place had the highest median, probably produced more trash. I would also look at the maximum, minimum, lower quartile and upper quartile. This would give me a better picture by looking at more points of the data.

Common Core Standards
Write down two “first impressions” you have about the standards.
I noticed that the standards build each year. The standards use what is learned the previous year to build on a higher learning and deeper understanding of what is being taught. I also noticed that some criteria isn’t taught every year. This is probably because it is above or too far below the understanding of the child at that time.

How do the concepts progress through the grades?
Each concept uses what the students have used previously to build onto that concept for the next year.

How do the concepts change and increase in rigor and complexity for the students?
The concepts continuously and consistently increase in rigor and complexity for the students. There aren’t jumps in learning; it is a step by step learning process. The concepts are simple in kindergarten and increase in difficulty into eighth grade. Teachers need to use the standards from the grade before and after the grade they are teaching to know how to prepare students for higher grades and what they should already be aware of.

Common Core and NCTM Standards
Does the Common Core Standards align with what NCTM states students should be able to know and do within the different grade level bands? (Note that NCTM is structured in grade level bands versus individual grade levels.)
I feel that when you look at the Common Core Standards as bands like the NCTM, that they do align. I feel the Common Core standards are more vague, but that a teacher can easily accomplish the goal of both groups of standards within his/her lessons.

Give examples of which standards align as well as examples of what is missing from the Common Core but is emphasized in the NCTM standards and vice versa.
An example of the standards aligning is in Kindergarten students are to classify and count objects, first grade students are to organize the data and know information about what the numbers mean in each category and in second grade, students are to are to draw a picture or bar graph to represent the data. All of these things are included in the NCTM standards. There is something missing from the Common Core standards in this grade level band; students make inferences and predictions according to the NCTM.

Curriculum Resources
Grade Two: Data Day: Standing Jumps and Arm Spans: In this lesson students measure their arm span in centimeters and length of a standing long jump in inches. They then compare the numbers, look at the difference in centimeters and inches and record the data.
·When using this activity, what mathematical ideas would you want your students to work through?
-I would want my students to understand the difference in centimeters and inches so they knew what was being measured. Also, students are to find the median of the class for the arm spans. Finally, the importance of proper data collection is important for this lesson so that all students’ jumps and arm spans are measured correctly and we are to accurately determine our median.
·How would you work to bring that mathematics out?
-I would bring mathematics out by showing students how to measure the arm spans and jumps. I would also show them the difference in centimeters and inches and when would be proper times to use them.
·How would you modify the lesson to make it more accessible or more challenging for your students?
To make the lesson more accessible, I would have students measure the arm spans and jumps using either centimeters or inches, but not different ways like the lesson called for. To make the lesson more challenging, I would have the students convert their centimeters to inches and inches to centimeters using math and not measurement.
·What questions might you ask the students as you watch them work?
I would ask them what they noticed about their arm spans and jumps and how the different lengths compared to their classmates. For example, “Susie” has a shorter arm span and jump than “Mark;” why do you think that is?
·What might you learn about their understanding by listening to them or by observing them?
I might learn that some have a deeper understanding of the correlation between the arm spans and jumps and the similarities and differences between students.
·How do the concepts taught in this lesson align to the Common Core Standards?
-This lesson aligns with the Common Core Standard that has students measure lengths of objects to the nearest whole number in the second grade.

Module Two (B)

Module Two (A)

Variations about the Mean
Problem D5: How would the line plots you created in Problems D2-D4 change if you were told that the mean was 6 instead of 5? Would this change the degree of fairness of these allocations?
-If the mean was 6 instead of 5, the line plots would move over one unit to the right. The degree of fairness would not change since none of the plots changed and the degree of fairness depends on the deviation from the mean.
Problem E5: Create a line plot with a MAD of 22/9, with no 5s.

x     x                          x
x     x     x                    x     x     x
1     2     3     4     5     6     7     8     9

Generating Meaning Article
-When I was in elementary school, many times we were given worksheets or numbers on a board, explained what an average was and how to find it, then told to find the average of the numbers. These activities did not mirror what I read in the article. The article demonstrated a much more hands on and fun learning for the students. I hope to have this type of learning in my class. Although my teachers did not do many hands-on activities, they did help us understand the mean along with showing the procedure. We learned what mean meant, the average of the number set, but also what the whole number could represent depending on what the numbers are representing.
I really liked how the students were able to work together to find their solutions and they weren’t just told to them. Over and over again I have said that I want a classroom where I am a teacher that leads my students, but they are able to explore and work together to find their solutions. I also want to be able to help students connect what they are learning to real life situations.
Did you have a more hands-on learning experience or one more like mine? Which would you prefer? How do you see your future classroom?

Working with the Mean –Activity
I really liked using the cubes for the activity. I was able to use different colors for the different bags (except one but I used a variation of that color to complete it). Seeing the numbers visually in the form of the cubes and line plot really helped me better understand and figure out the problem.
I used the cubes by putting the cubes in order by number of cubes in each set then moving them around until I could see that the mean was 8.
This model of the cubes shows me that when you divide the cubes up equally, there are 8 cubes in each “bag.”
I used the line plot much the same way that I used the cubes. The difference is that I was moving “x’s” around instead of cubes.
The line plot shows me that when the x’s are all moved around equally, there are 8 x’s in each spot.
The average tells us that if the data set was to be separated into different pieces, each group would have 8.

How Much Taller? Video and Mean Case Studies(Required Blog Summary… See Module for other questions.)
I was surprised by the foundational understanding the students already had of the mean. Many students were talking about the average and the mean without knowing that they were. It also surprised me that the students had an understanding of the average when they came up with a decimal. The students knew that they could have a part of something so they chose to round the number. They did not allow the decimal to take away from their understanding of what they knew.

·Do some reading and thinking about the concept of the average or mean and its application in schools through the bell curve. What does the mean suggest in terms of grades and achievement? Why is the concept represented with a bell curve? What are the implications for grading on the curve? Is it fair? Why or why not?
The mean in the bell curve suggests the average score of all of the students’ scores. The mean is the top of the bell curve, the most middle point, and is assigned the C and the other scores fall accordingly before and after the curve. The mean suggests that those are the average scores for the data set. The highest scores get the A and the lowest scores get the F, even if by a traditional scale each student should receive an A. Most of the students should fall under the average scores which creates the bell shape. I do not think this is a fair way of grading. Students should be able to receive the grade they study for and earn. What if a student never studies and always fails the test? He/She will always pull the average down. Or if someone always makes a perfect score, he/she makes it impossible for students to get a higher grade they earned.

·Find examples of averages in a daily newspaper, from the sports page, or any page. Then describe what these averages “mean” –their significance, implications within the context of the story, and so forth.
In the newspaper, I found averages for different sports teams and their team member’s batting averages. These averages are the average number of hits each player makes when up at the plate. This average can be brought up or down by a really good or bad game. These batting averages can be used to determine the abilities of the players on the field.

Module Two (A)